
ON-PNT® is a comprehensive, engineered facility condition assessment and asset management database system with GIS web and mobile mapping capabilities. When you’re managing multiple facilities on a campus or across multiple locations, keeping track of all the defects and details of your roof systems can be difficult without a comprehensive tool like ON-PNT®.
ON-PNT® offers features to assist in every phase of a program.
- Data Collection – The GIS-enabled mobile app enables field crews to efficiently collect field data and allows for seamless field-to-office connectivity.
- Data Consumption – The ON-PNT® dashboard provides high-level executive summary metrics, managed as Key Performance Indicators (KPIs), customized reports & charts and budgetary modeling tools.
- Data Visualization – Visualize data from building system assessments and analyze the effectiveness of repairs and maintenance.
- Data Management – ON-PNT® serves as a robust program and project management tool with extensive document management and task management capabilities.
Dynamic GIS mapping—a critical feature of this program management tool.
GIS mapping allows you to capture, store and display data related to specific geographic locations using latitude and longitude coordinates. The GIS mapping feature of ON-PNT® allows the user to query and filter data in order to easily visualize the condition of building system assets and analyze how repairs and maintenance will affect the bottom line.
Establish and visualize the conditions of the assets.
The GIS-enabled HTML 5 mobile map helps bridge the gap between the facilities office and field crews collecting data during a comprehensive assessment or while performing maintenance on the building envelope. When your data is collected in the field, it is also connected to the central database – providing seamless field-to-office connectivity.
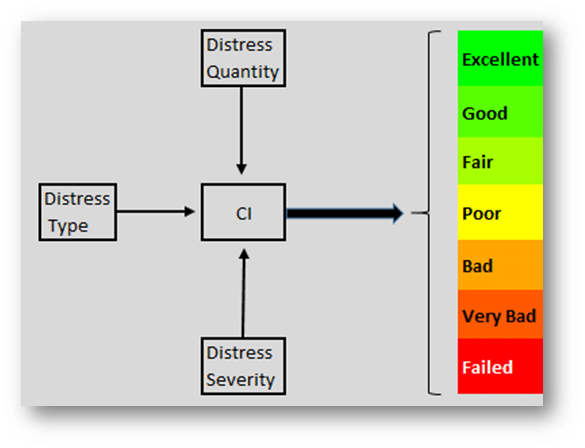
Whether assessing a roof, exterior facade, sidewalk or parking garage, the condition of each section is scientifically calculated by the quantity, type and severity of defects within each section. On the map, the condition is visually identifiable by a color code. Additionally, you are able to view different sections based on their defects and repair status. For example, if you want to see all the outstanding roof repairs that are needed across your campus, simply filter the data to see this data displayed on the map.
Visualize data that comes from assessments for specific sections.
When you click on a building envelope section, the system will show you all pertinent information about that specific section, including the:
- Site name and location
- Building ID and section ID
- The assessor who collected the data and assessment date
- The year the roof was installed
- Total square footage
- Total cost of defects
- Repair or replacement budgets, including consulting fees
- Remaining service life of the section (and RSL if repairs and/or ongoing preventative maintenance is performed)
- Condition Index
- Replacement Year, including a replacement year if ongoing repairs and/or preventative maintenance is performed
- Annual total cost of ownership and TCO savings
- Overview photo of the section
When you can associate a condition index and cost with each section, that’s when you can start making smarter, more sustainable decisions about how to triage projects, maximize your investment and ultimately lower total cost of ownership.
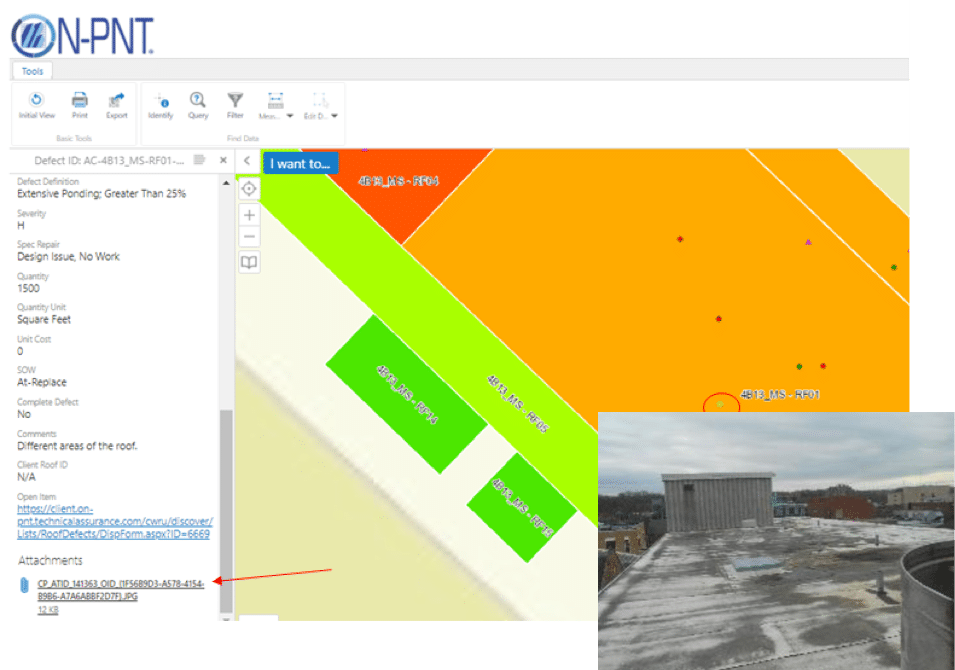
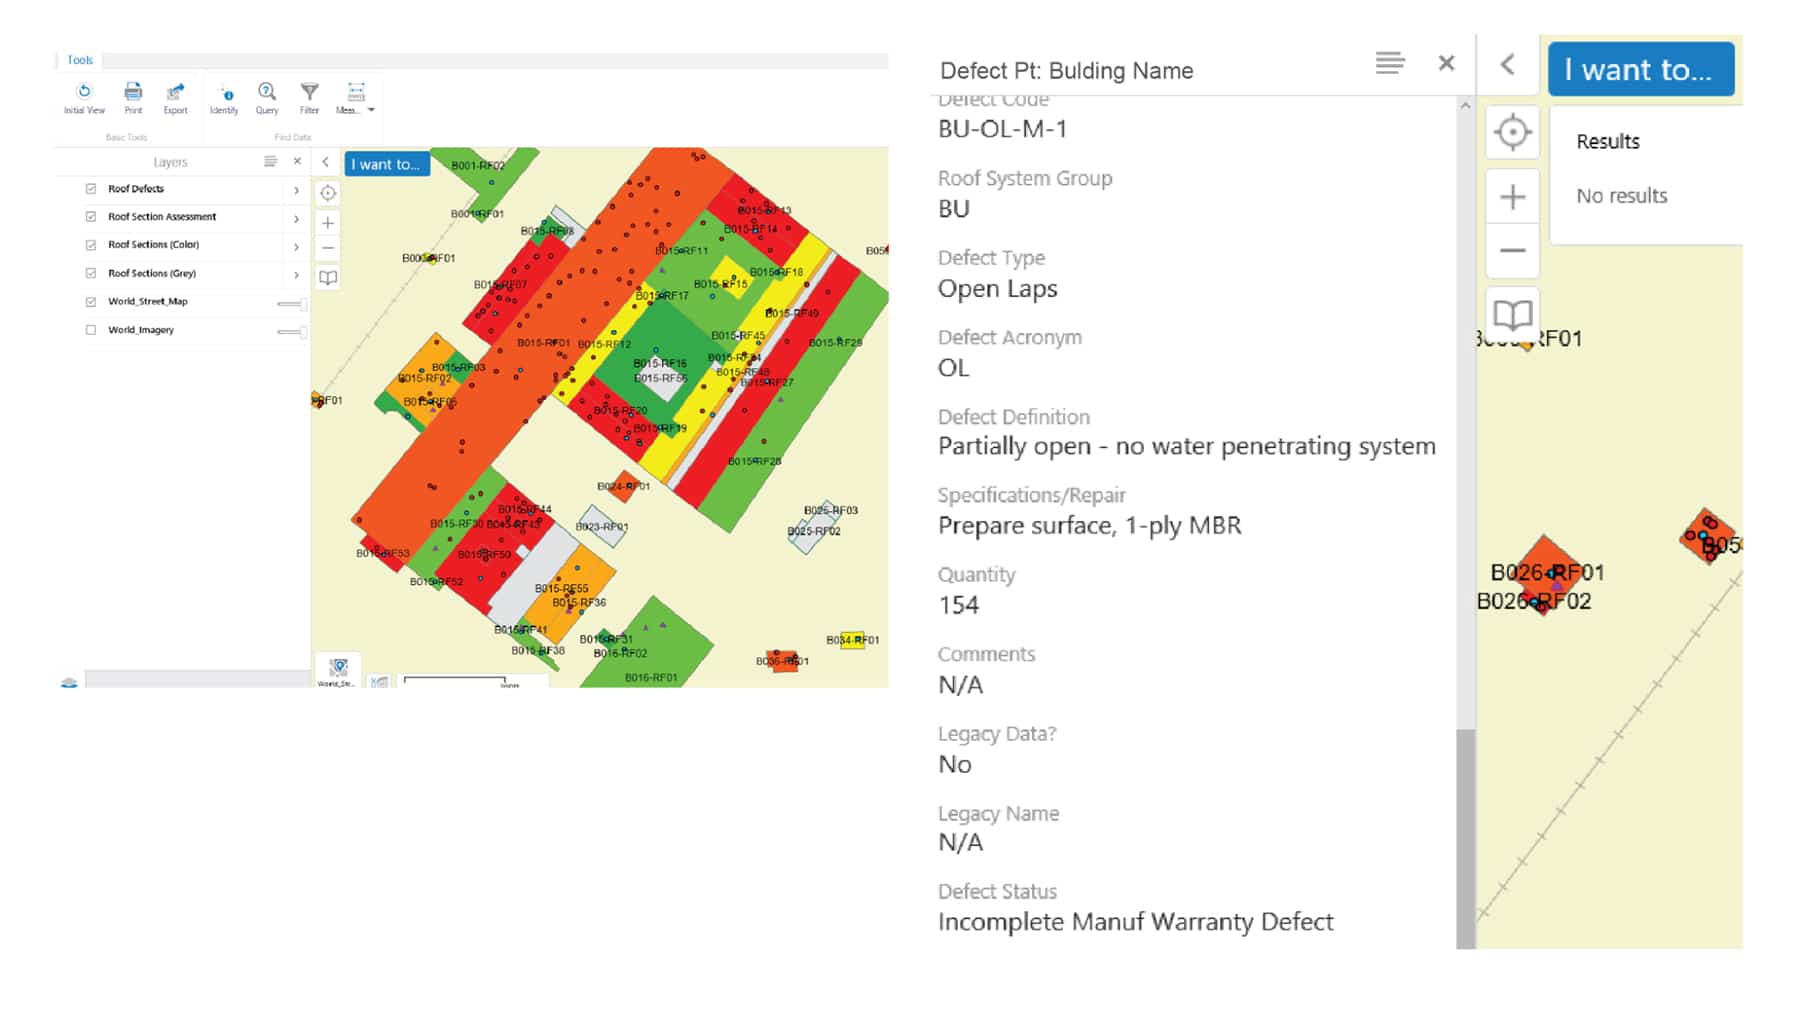
All extensive data collected in the field is stored within this program and is easily accessible by clicking on a specific building envelope section. This allows you to visualize and find meaning within the data that will help you better manage your facilities and make smarter decisions about repairs and replacement projects. Defect data collected within ON-PNT includes:
- Defect location
- Defect type
- Specifications/Repair
- Quantity
- Defect repair status
- Severity level
- The last assessment date
- Comments
- Picture of the defect
ON-PNT® is also able to integrate with client’s CMMS databases to ensure that both databases are kept up-to-date and consistent.
Is ON-PNT® the solution for you?
Contact the Technical Assurance team to learn more about GIS mapping, and how the ON-PNT® program as a whole can benefit you and your facilities.